We’re focused on helping companies protect their Airtable data with On2Air Backups, automated backups for Airtable to Google Drive, Dropbox, and Box.
The Airtable extension in this article is no longer being supported. We recommend using Airtable Interfaces.
An Airtable dashboard is designed to provide a single interface to view and edit various parts of your data, making it easier to visualize and analyze company information.
With a dashboard, you can get an overview of specific data, such as expenses, sales, and projects to help you make informed decisions.

In this article
- What are Airtable dashboards?
- Does Airtable have dashboards?
- How do I create an Airtable dashboard with On2Air Amplify?
- On2Air Amplify Airtable Dashboard Features
- Can you create charts in an Airtable dashboard?
- Using Google Sheets with Airtable for More Advanced Charts
- How do I visualize data in Airtable?
- Creating Better Airtable Dashboards
What are Airtable dashboards?
A dashboard is an essential tool for viewing and analyzing data and an excellent way to visualize data in one place. Airtable combines the functionality of a database and the layout of a spreadsheet. With an Airtable dashboard, you can view data from multiple tables at once, focus on specific records and fields, and create a team or personal view.
Does Airtable have dashboards?
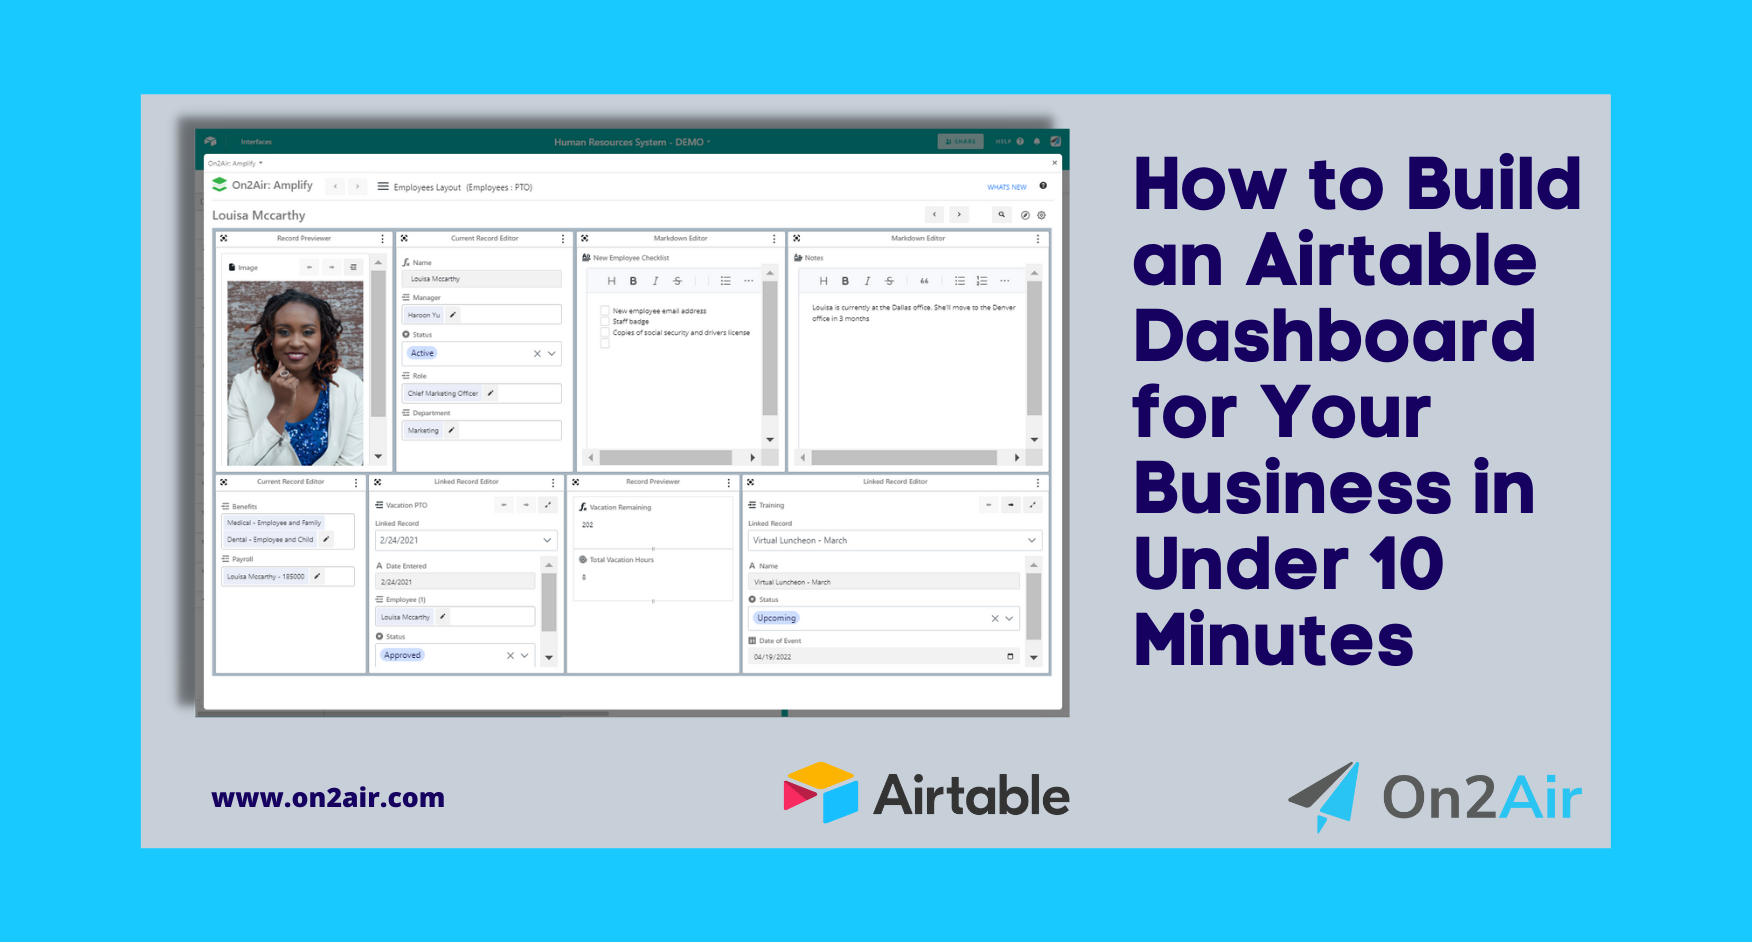
You can create dashboards in Airtable with the On2Air Amplify app. Using On2Air Amplify, you can create a dashboard to view multiple tables at once, add new records to any table, view large records in easier-to-read sections, create rich-text notes, view websites and attachments in full screen, and so much more.
Instead of presenting collaborators with an entire base full of information, you can create a dashboard layout and set permissions to focus their attention on a specific view or records. With Amplify, you can edit records, view records, and add new records from just one place. You can navigate through your entire base from a single or multiple dashboards.

How do I create an Airtable dashboard with On2Air Amplify?
Here’s how to create an Airtable dashboard in On2Air Amplify:
1. Add On2Air Amplify from the Airtable App Marketplace – Click here to add it to your base

2. Click Create new layout

3. Click Add Block View

Now, you can start creating your layout by adding Blocks!
There are multiple blocks available to display your Airtable records in various ways.


Current Record Editor: View or edit data from a single record. Customize the record by displaying or hiding fields.
Linked Record Editor: View or edit data in Linked record field types that are connected to other tables. Customize the record by displaying or hiding fields
Record Previewer: View content in full-screen from the following field types: attachment, URL, long text, single-line text, formula, rollup, and lookup.
Google Docs/Sheets/Slides Editor: View and edit Google Docs, Sheets, or Slides directly inside Airtable.
Linked Table Viewer: View a list of records from a linked table or view.
Text Editor: Write and view your text in plaintext format.
Markdown Editor: Write and view your text in Markdown format.
HTML Editor: Create and edit your text in HTML format.
JSON Editor: Create and edit data in JSON syntax.
4. Choose the Airtable fields you want to display in your Block

5. Rearrange your dashboard to fit your workflow

On2Air Amplify Airtable Dashboard Features
On2Air Amplify is the easiest way to interact with your Airtable data and provides more customization and permissions for dashboards.
Add Amplify to your Airtable base
Amplify features
- Create multiple blocks in your dashboard displaying various fields
- View multiple tables and linked records from 1 dashboard
- View documents or attachments in full-screen, perfect for presenting or reviewing important documents.
- Edit current records or create new records directly from the dashboard
- Browse individual records quickly and easily
- Use dashboards or blocks in full-screen
- Use the text editors to format notes and content
- Advanced search for your Airtable base
- Set permissions on dashboard layouts per collaborator
- Edit and view Google Docs, Sheets, or Slides directly inside Airtable
See how the machining manufacturer, Defiant CNC, uses Amplify to create a robust system in Airtable that stores data about their machining equipment, supplies, diagrams, and other information related to manufacturing parts. It uses Airtable automations, scripting, forms, and On2Air Schema.
After spending some time bouncing back and forth through multiple tables, Jeremy, Defiant CNC Founder and CEO, jumped at the chance to use On2Air Amplify for his machine shop base and his ERP systems customers. Now, each time they manufacture a part, they can create the part record, link all the records together, and use the On2Air Amplify dashboard to view parts and process info, blueprints, images, machining specs, and other relevant data.
How Defiant CNC Streamlined Their Manufacturing Process in Airtable with an On2Air Amplify Dashboard
Can you create charts in an Airtable dashboard?
There are two ways you can view Charts in On2Air Amplify. You can create charts from the App dashboard, and you can also add the charts to Amplify with a Shareable apps dashboard.
You can view charts through a shareable apps dashboard or through the Share app beta. If you have the Share App beta enabled in your base, you can display a specific Chart app in Amplify. Learn more about How to View Airtable Charts in Amplify.
Note: You will have to create a private Share link to your base. Please determine if you want to have Share enabled before proceeding with this tutorial.
Using Google Sheets with Airtable for More Advanced Charts
If you need even more advanced charts, you can export Airtable to Google Sheets with On2Air Backups. While both tools are similar, many companies still rely on Google Sheets at the same time as they use Airtable.
How do I visualize data in Airtable?
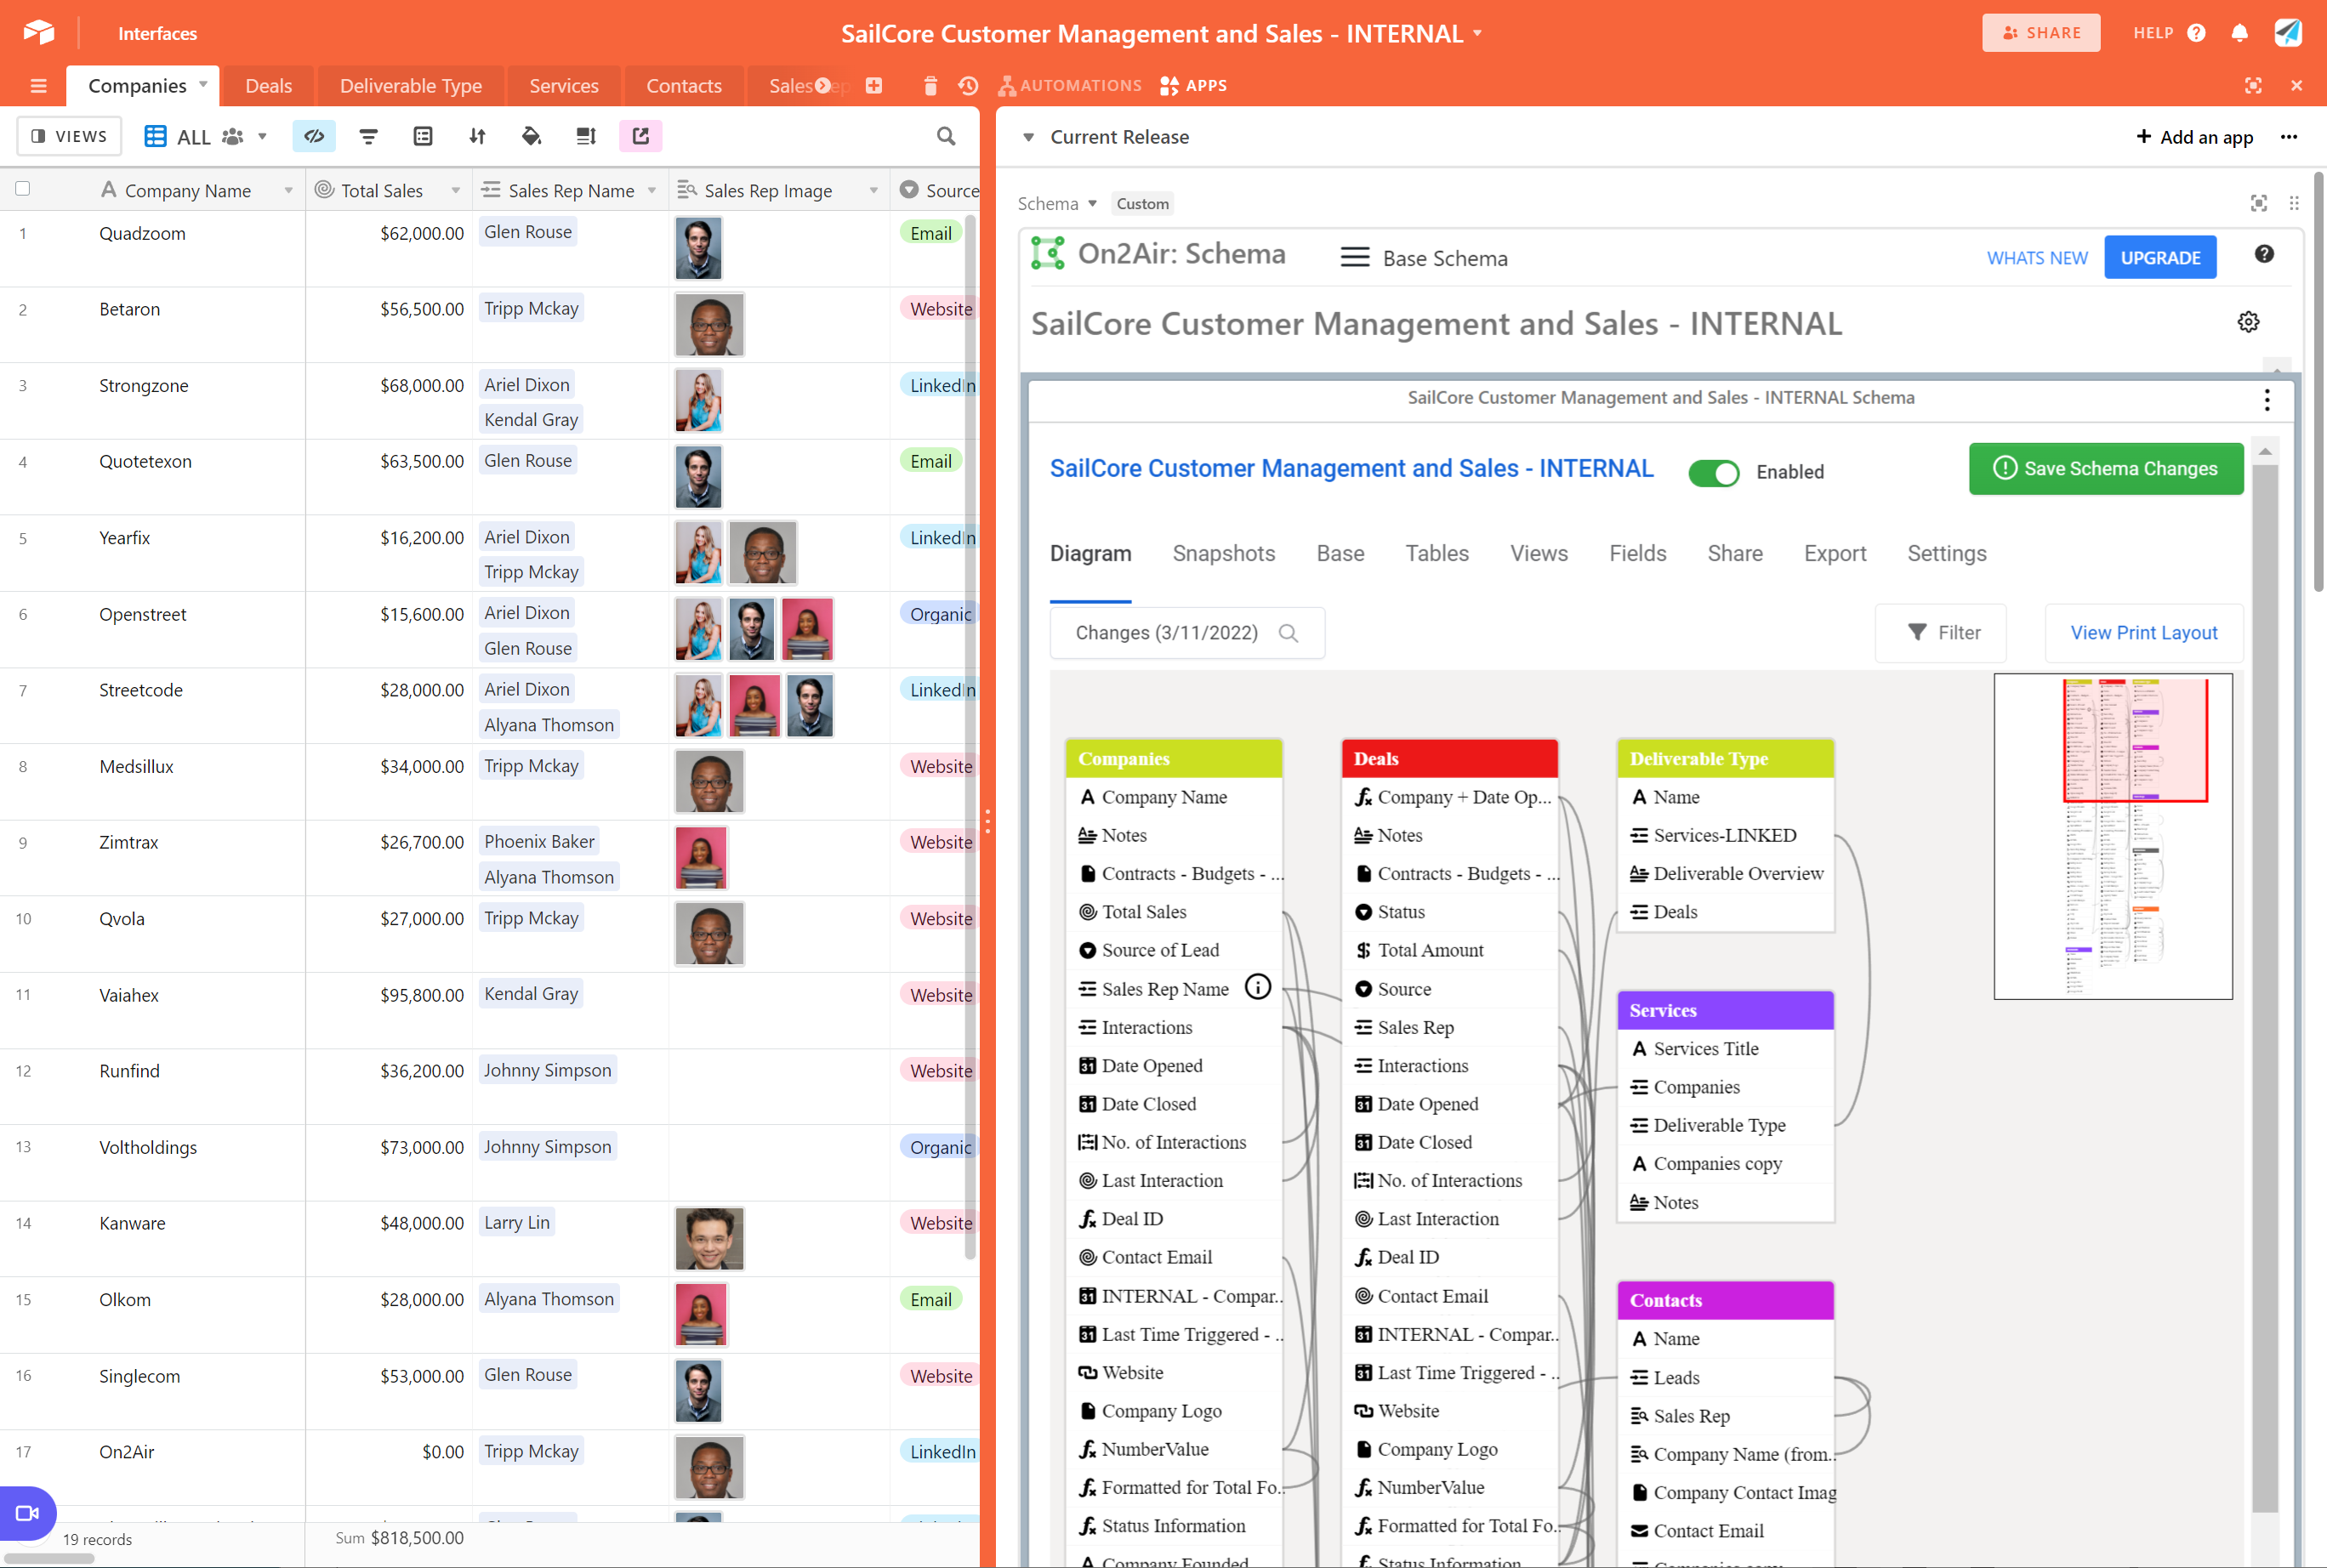
You can use the dashboard to visualize data. If you need to visualize your base design, layout, and field relationships, see how to visualize and monitor your Airtable base structure with On2Air Schemas.
The On2Air Schemas app generates a diagram to visualize your Airtable base structure and track changes to meta information for all tables, views, fields, and relationships.

Creating Better Airtable Dashboards
An Airtable dashboard will help you to organize and visualize your data in a truly personalized way. On2Air Amplify is a great option for those looking for an all-in-one app to view multiple tables from a single dashboard, view large records in sections, and so much more.

